Millions of Californians are working at home to help stop the spread of COVID-19, including the staff of the Coalition for Clean Air. With such an unprecedented behavior change going on, we are being asked how much of an impact this change of pattern is having on air quality. It’s a complicated story that deserves an accurate and detailed answer.
Air Pollution and COVID-19
Air pollution has long been linked to a greater risk of respiratory infection, which in turn leads to more susceptibility to disease. That means the virus could be more damaging to people who have lived, worked, and played in polluted areas, because their lungs may already be impaired and their defenses weakened. There is evidence from previous outbreaks of similar coronaviruses that people exposed to dirty air are at greater risk of dying. Scientists who studied the SARS outbreak in 2003 found that infected patients from regions with higher air pollution were 84% more likely to die than those in less-polluted areas.
“There is fairly strong evidence that air pollution increases the risk of acute low respiratory infections. And it may have contributed to the extent of the outbreak in Wuhan.”
-John Balmes, Professor of occupational and environmental medicine at UCSF, California Air Resources Board Member
Whether or not there’s a link between the spread of COVID-19, one thing is clear: less air pollution creates healthier people and stronger lungs, which makes individuals less likely to be susceptible to infectious disease. That’s nothing to sneeze at.
Our (In)Action and Air Pollution Reductions
It’s no secret that pollution levels across the globe have plummeted as people either choose or are required to shelter in place. Maps comparing nitrogen dioxide (NO2) levels at this time last year in China, Italy and South Korea* are striking. Closer to home, the Air Quality Index (AQI) has been hovering near zero. Yet, despite average vehicle miles traveled being reduced by 70% or more, we have not seen a complete elimination of air pollution. Why is that and what can we learn?

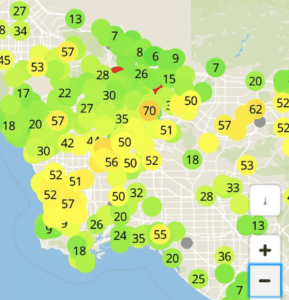
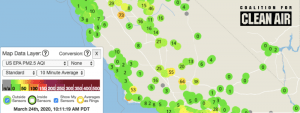
While air quality is still good, there are plenty of “moderate” hot spots.
To understand how our actions are affecting air pollution it’s important to understand that there are different types of air pollution coming from difference sources. Heavy-duty trucks, off-road equipment, trains and ships, for example, contribute more than half of California’s particulate matter (PM 2.5), primarily in the form of diesel engine exhaust, a carcinogenic toxic air contaminant. Diesel engine emissions in general are believed to be responsible for about 70% of California’s estimated known cancer risk attributable to toxic air contaminants and the primary cause of the state’s estimate 7,500 premature deaths each year. Meanwhile, California’s 17 refineries produce 2 million pounds of PM 2.5 and 1.9 million pounds of harmful oxides of nitrogen (NOx) annually. Wood burning in the winter and brush fires at other times also contribute to the toxic mix.
In addition to these sources of air pollutant emissions, weather plays a very important role. It is coincidentally one of the reasons why CCA has actively installed PM 2.5 monitors throughout California. Despite the fact that frontline communities near freight hubs bear the brunt of air pollution, on certain days you may think you are in a pristine clean air location (i.e., South Bay beach communities) but because of the weather that day, you actually may be breathing in some of the worst air in California. Temperature, humidity, wind speed, wind direction, and the height of the inversion layer in many air basins all factor into the quality of our air. Thanks to climate change, there’s also the ever-present danger of air pollution from wildfires. And of course, there’s the rain, which helps to temporarily relieve us, even as it mixes with toxic particles to pollute our waterways.
The Lesson? Driving less helps (a lot), but more is needed.
There’s no doubt that driving less is helping to drive down levels of air pollution. This is especially true when it comes to greenhouse gas emissions, from which the increase in vehicles miles traveled during the past few years has had a disproportionate impact. But reducing vehicle miles traveled is only part of the solution. We have to address emissions coming from our other sources.
That’s why we continue to push hard to make sure California transitions to cleaner trucks, busses, ships, trains, planes and off-road equipment. It’s why we are pushing for incentives to help you get into a zero emission vehicle. It’s why we continue to push to get the dirtiest trucks off the road. It’s why we continue to hold polluters responsible. And it’s why we run campaigns like California Clean Air Day (October 7, 2020) to encourage you to take additional actions to address our intransigent air quality challenge.
Thanks to the combination of rain and so many people not driving, we’ve enjoyed truly great air quality in most of the State. If you felt great walking outside these past few weeks, don’t let that feeling go. We know from China’s example, however, that it is likely to be short lived. Remember how it felt to be able to breath deep. That’s what we are fighting for. And that’s what we’re going to keep fighting for until we get there.
If we all work together, we can make that feeling last forever.
[share]


Nice,
I have made an application based on Sentinel-5 data on NO2 and Google Earth Engine. The decrease was significant in LA but last only one month, the NO2 levels start to increase again and the peaks are similar to pre-lockdown.
https://alexamm4.users.earthengine.app/view/covid-19-air-pollution